
EIA - Results
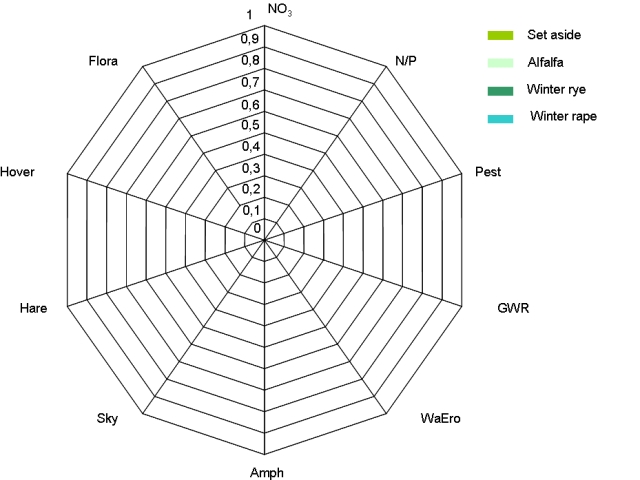
The EIA results are graphically displayed in a radar chart which gives a good overview over the performance of an evaluated cropping practice. The axes of the chart represent the different indicators for which an environmental impact assessment was performed. The circles represent the values the single indicators can reach. (Note: the output of the fuzzy tool that is used to evaluate the cropping practices with regard to their performance towards the environmental impact assessment indicators is a dimensionless value that ranges between 0 and 1.) To get an overview of the indicators defined within MODAM click here.
To see which indicators are used in this example click next.

